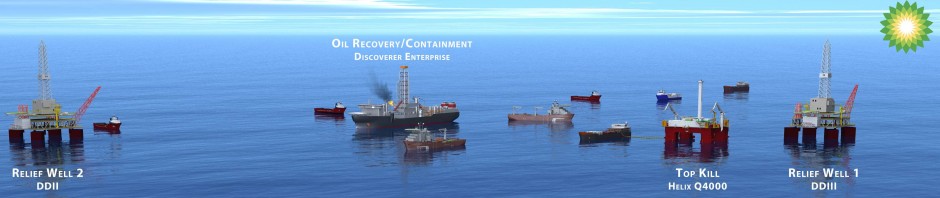
Here is the latest on the two relief wells’ progress.

Image courtesy of BP. © BP p.l.c.
Here is the latest on the two relief wells’ progress.
Image courtesy of BP. © BP p.l.c.
The condition of the Macondo well before the explosion continues to be a concern as the latest attempt to seal the well (Collar, Cap, and Collector) has not reached the desired PSI of 7,000. Rather the PSI has reached just 6,863 psi since it was capped on July 15 according to BP’s website.
Of note is a decision by the engineers to plug off the last 2,000 feet of the then 13,000 foot hole with cement and continue in a new direction. Does this old “2,000 foot” pose a problem? Will the relief well be able to account for this?
Here is the detail of what happened on March 8, 2010 from the WSJ:
[W]orkers discovered that gas was seeping into the well, according to drilling reports from the rig reviewed by the Journal. Workers lowered a measuring device to determine what was happening, but when they tried to pull it back up, it wouldn’t budge. Engineers eventually told them to plug the last 2,000 feet of the then-13,000-foot hole with cement and continue the well by drilling off in a different direction.
The episode took days to resolve, according to drilling reports, not counting time lost to backtracking and re-drilling. Each additional day cost BP $1 million in rig lease and contractor fees.
Another scary note from the WJS.com article:
The rock was so brittle in places that drilling mud cracked it open and escaped. One person familiar with the matter estimates BP lost at least $15 million worth of the fluid.
As disclosed in the New York Times today, Lloyd’s Register Group, a maritime and risk-management organization, dispatched two investigators to inspect the rig March 12 through 16. On the rig they conducted focus group and one-on-one interviews with at least 40 Transocean workers.
Not surprisingly, Lloyd’s investigators reported:
“a high degree of focus and activity relating to well control issues,” adding that “specialists were aboard the rig to conduct subsea explosions to help alleviate these well control issues.”
The mechanical problems discovered by investigators found problems with the rig’s ballast system that they said could directly affect the stability of the ship. They also concluded that at least one of the rig’s mud pumps was in “bad condition.”
The report also cited the rig’s malfunctioning pressure gauge and leaking parts and faulted the decision by workers to use a type of sealant “proven to be a major cause of pump bearing failure.”
What happened on the rig in March? How much of an impact will the first well branch have on the relief wells likely success?
The truth exposed by the BP oil spill is how damaging oil use can be for our environment and planet. It’s tough to see the impact of climate change because of its small, subtle changes over many years. Seeing wildlife destroyed by the oil spill and knowing that most of our future oil will come from deep sea projects (similar to this disaster), it’s time to think serious about our alternatives.
The first thing I would explore to nudge our incentives in the right direction would be Federal Subsidies. Barry Ritholz recently put together a chart summarizing the use of federal subsidies for fossil fuels and renewables based on data from the Environmental Law Institute.

The vast majority of subsidy dollars to fossil fuels can be attributed to just a handful of tax breaks,
Note: Almost half of the subsidies for renewables are attributable to corn-based ethanol.
The argument that oil is cheaper than renewables has less strength when all the subsidies are accounted for. I’d take a wind turbine on a hillside over oil and the inevitable environmental destruction any day.
Source:
The Big Picture, Barry Ritholtz
http://www.ritholtz.com/blog/2010/07/subsidizing-fossil-fuels/
Will the relief wells work? The problem is that there is another 2,000 foot well branching off from the current well. Will the new relief wells intersect the well below the first attempt and the second attempt? Or is it unclear which well is leaking and where the relief wells will intersect?

Will the relief wells work?
Details on the well casing program used by BP.

Reference: Macondo History Before the Blowout
It would be great if BP’s response was a little more tech/web 2.0 friendly. Why aren’t they fostering the creative ideas from so many people with talented minds.
Instead, submitters to the response form are sent to the following site with a list of checked and “x”ed items.
See here (click on the image to see the page):

Already Considered and Not Possible / Not Feasible
If you have an idea not on this list, submit it here: http://www.horizonedocs.com/artform.php
What was BP thinking when they chose the unconventional single long pipe design into the reservoir?
From the WSJ article
The cement job was especially important on this well because of a BP design choice that some petroleum engineers call unusual. BP ran a single long pipe, made up of sections screwed together, all the way from the sea floor to the oil reservoir.
Companies often use two pipes, one inside another, sealed together, with the smaller one sticking into the oil reservoir. With this system, if gas tries to get up the outside of the pipe, it has to break through not just cement but also the seal connecting the pipes. So the more typical design provides an extra level of protection, but also requires another long, expensive piece of pipe.
“I couldn’t understand why they would run a long string,” meaning a single pipe, said David Pursell, a petroleum engineer and managing director of Tudor, Pickering, Holt & Co., an energy-focused investment bank. Oil major Royal Dutch Shell PLC, in a letter to the MMS, said it “generally does not” use a single pipe.
By the time the well began shooting mud out of the derrick, it was too late. This was no ordinary gas kick. It was far more ferocious. The curse of Macondo lived on.
:
Prior to the BP oil well explosion on April 20, 2010, BP hired Halliburton (the cementing contractor) to plug the well and temporarily abandon it, a standard practice in the industry.
Still, by mid-April, the well seemed a qualified success. BP was convinced it had found a lot of oil. Until engineers in Houston could make plans to start pumping it out, the workers on the nearly complete well, in a standard practice, would plug it and temporarily abandon it.
One of the final tasks was to cement in place the steel pipe that ran into the oil reservoir. The cement would fill the space between the outside of the pipe and the rock, preventing any gas from flowing up the sides.
Let’s hope that the new cap proves the well is solid and intact.

If it proves that the well when capped is forcing the oil out of other parts of the broken BOP or into the seabed (below the seafloor) we have new things to consider.
Of note is a decision by the engineers to plug off the last 2,000 feet of the then 13,000 foot hole with cement and continue in a new direction. Does this old “2,000 foot” pose a problem? Will the relief well be able to account for this?
Here is the detail of what happened on March 8, 2010 from the WSJ:
[W]orkers discovered that gas was seeping into the well, according to drilling reports from the rig reviewed by the Journal. Workers lowered a measuring device to determine what was happening, but when they tried to pull it back up, it wouldn’t budge. Engineers eventually told them to plug the last 2,000 feet of the then-13,000-foot hole with cement and continue the well by drilling off in a different direction.
The episode took days to resolve, according to drilling reports, not counting time lost to backtracking and re-drilling. Each additional day cost BP $1 million in rig lease and contractor fees.
Another scary note from the WJS.com article:
The rock was so brittle in places that drilling mud cracked it open and escaped. One person familiar with the matter estimates BP lost at least $15 million worth of the fluid.
Here is the latest attempt to stop the flow of oil from the leaking well. Let’s hope it works.
Once the new cap is installed tests will be performed to calculate the pressure of the oil flowing from the pipe. If the tests on the well show the pressure rising and holding — an indication that the well is intact, with no significant damage to the casing pipe that runs the length of the well bore to 13,000 feet below the seafloor — BP, working with government scientists, could decide to leave the valves closed, effectively shutting off the well.
On the other hand, the tests could show pressures that are lower than expected, Mr. Wells said, an indication that the well is damaged. That could mean that oil and gas are leaking into the surrounding rock.
In that case, keeping the cap closed could damage the well further. The valves would have to be reopened and oil would start escaping from the well again, although much of it, and perhaps eventually all, would be funneled through pipes to surface ships.
Blow Out Preventer Detail
BP technical briefing and update on Gulf of Mexico oil spill 10 May 2010
Tony Hayward
Failure of the Large Dome:
A lot more gas involved in leak than previously believed.
Moving to a smaller dome because there will be less seawater in it and less likely to hydrate formation. Methanol injection to aid deployment of the small dome. Small Top Hat is about the size of a barrel and sucks up the oil.
What was the failure of the Large Dome and the top hat. Is there detail of the hydrate formation of the top hat?
A: Quantity of hydrate is greater than they were able to cool with the warm water being pumped down. Appears to be too many hydrates. Use this to help block the leak. Hydrates were real failure of the containment dome.
Top hat was a coffer dome according to BP. It was a 40ft tall and weighed 78 ton. It failed when the top of the dome filled with ice and blocked the flow. The hole at the top was 12″. They were in the process of connecting the pipe to the surface piping lined with warm sea water when the hydrates at the top froze and blocked the flow. The dome became too buoyant to form a watertight seal against the sea floor and permitted the oil to spill out around it. The spewing oil is a gassier flow than anticipated. The thought behind the smaller top hat is that keep water away from the gas and the hydrates can’t form. Pump methanol into it to prevent the hydrates.
Use the frozen water hydrates to stop the flow. Inject methane hydrates into the BOP to stop flow along with junk shot.
Water is 30 ºF at the sea floor.
BOP:
1. Junk Shot and Top Kill: Junk into choke valve, mud down kill valve to reduce hydrostatic head down, and fill it with cement.
2. Remove the riser and swing in another BOP
3. Swing across a valve.
Risk of Relief Well Not Working:
Drilling two relief wells. They have to intersect a 7 inch well bore. This is not easy, though has been done before. Q: Is the second well a backup plan?
A: Yes, as a backup for the first well. Pump in mud to kill the well and then fill it with cement.
No Plan D: Hayward, “Relief wells will ultimately be successful.”
Kent Wells
Background of top hat and junk shot options
#1 priority is how do we shut the stop off. Incredibly complicated because the BOP failed.
Liquid carbon dioxide forms only at pressures above 5.1 atm; the triple point of carbon dioxide is about 518 kPa at -56.6 °C. The critical point is 7.38 MPa at 31.1 °C.
Plumbers use equipment that forces pressurised liquid CO2 into a jacket around a pipe; the dry ice formed causes the water to freeze, forming an ice plug, allowing them to perform repairs without turning off the water mains. This technique can be used on pipes up to 4 in (100 mm) in diameter
-wikipedia
Oil freezes -18 Celcius (motor oil), diesel -30 C,
Cuide Oil -31 F (-35 C)
Kind of temperatures you’ll get with dry ice (-78°C) or even liquid nitrogen (-196°C)
Olive oil: 6C (refrigerator temp)
Sunflower oil: 17C
Aviation gasoline: -60C
Crude oil: I found lots, no one specific temperature – it depends on the assay/test run
Going from high pressure to low pressure cools the fuel naturally.
Water freezes at a temperature below 0 °C under a pressure higher than 1 atm (0.10 MPa). Consequently, water also remains frozen at a temperature above 0 °C under a pressure lower than 1 atm. The melting of ice under high pressures is thought to contribute to the movement of glaciers.
The freezing temperature of salt water depends on how much salt you put in. Oceanographers define the “salinity” of water as the number of grams of salt per 1000 grams of water. (Since 1000 grams of water is almost exactly 1 liter, it’s also grams of salt per liter).
Here’s a table which gives the freezing point of water at a number of different salinities:
S(g/kg) 0 10 20 24.7 30 35
T(freezing) (C) 0 -0.5 -1.08 -1.33 -1.63 -1.91
Away from rivers and glaciers, the ocean has a salinity of about 35. The Atlantic is about 1 salinity units saltier than the Pacific. So ocean water freezes at about -1.91 degrees C.
Expect the freezing temperature to drop by .054 degrees for each gram of salt.
When saltwater freezes, the salt can’t join with the ice crystals, and tends to stay in the liquid water. As a result, ice made from salt water has less salt in it than the water that’s left behind. The unfrozen water gets saltier and saltier, and eventually becomes the solution will become saturated. This happens for salt in water at -21.1°C, which therefore is the coldest a saturated solution of salt and water can get.
At that temperature, the salt begins to crystallize out of solution, along with the ice, until the solution completely freezes. The frozen solution is a mixture of separate salt (NaCl·2H2O) crystals and ice crystals. This heterogeneous mixture is called a eutectic mixture.
Source: http://www.worsleyschool.net/science/files/saltandfreezing/ofwater.html
The density of surface seawater ranges from about 1,020 to 1,029 kg•m−3, depending on the temperature and salinity.
Deep in the ocean, under high pressure, seawater can reach a density of 1,050 kg•m−3 or higher.
Here is a phase diagram of Carbon Dioxide (CO2):
")
Phase diagram of ice:

The phase diagram of water ice, illustrating the pressure and temperature conditions under which different crystal structures of ice are stable.
The density of dry ice varies, but usually ranges between about 1.4 and 1.6 g/cm3 (87–100 lb/ft3).
Dry Ice, solid C02 would therefore sink to the bottom in salt water.
The density of fresh water ice is 0.92 g/mL.
Maximum ice-crushing strengths averaged from about 475 lb/in2 at the White River near Oacoma/Presho site to about 950 lb/in2 at the James River at Huron site. See this pdf for additional information on the ice cores taken from South Dakota
475 lb/in2
to
950 lb/in2